Latest Nightly Builds

for OS X 64 bit

for Windows with Installer 32 bit

for Windows 32/64 bit

System Requirements

  • For Windows
    • Windows Vista or later
    • Tested with Windows 7 and 8.1
  • For OS X
    • Mac OS X Lion 10.7 or later
    • 64 bit CPU
    • Tested with OS X 10.9 Mavericks

Sample Databases

Entrez gene_info

Others

Designed for big data viewing and analysis

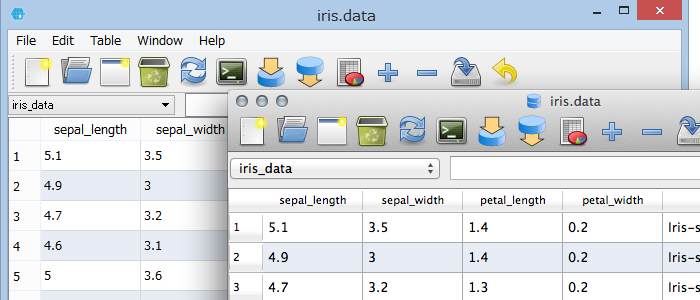
Hyokai is designed for fast data viewing, filtering and analyzing. This software allows you to view more than one million rows quickly after loaded.
screenshot

Supported formats:

  • Comma Separated Values (CSV)
  • Tab Separated Text
  • SQLite

Supported databases:

  • SQLite 3
  • MySQL
  • PostgreSQL
  • OBDC

Import easily with wizard

screenshot

Quick sorting & filtering

screenshot

Data summarization and export data to R

screenshot

Visualize your data quickly

screenshot

screenshot

screenshot

screenshot

Analyze with SQL

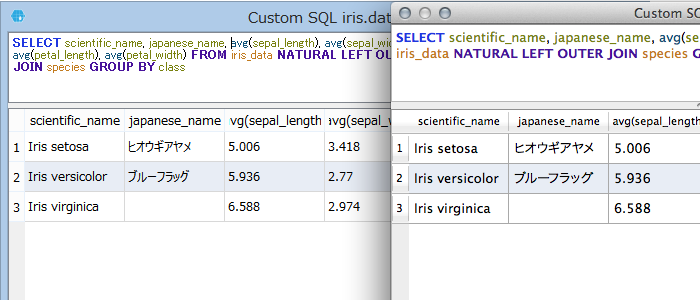
SQL enables to search and summarize easily and quickly. screenshot

Tutorial

Analyze microarray

1. Download sample data and probe information with R

At first, we have to prepare data to analyze. This is an example of downloading and writing out data to analyze with Hyokai.
source("http://bioconductor.org/biocLite.R")
biocLite(c("GEOquery", "affy", "mouse4302.db"))

library(GEOquery)
library(affy)
library(mouse4302.db)

mouse.probe.keys <- mouse4302ENTREZID
mapped_probes <- mappedkeys(mouse.probe.keys)
probe2gene <- as.data.frame(mouse.probe.keys[mapped_probes])
write.csv(probe2gene, "probe2gene.csv")

geo.data <- getGEO("GSE46443")
geo.exprs <- exprs(geo.data[[1]])
write.csv(geo.exprs, "expressiondata.csv")

2. Create a new database

By default, Hyokai will load data into on-memory-database. If you want to analyze data later, creating new database file is recommended.

3. Import data into the database

All data should be imported into the database. In this example, import "expressiondata.csv" at first.


Hyokai suggests a schema of a table automatically from a file. If something wrong, please fix the schema in this dialog.

4. Overview of the main window

Now all preparations were done. Overview of the main window is shown in the figure below.

5. Filter data

Hyokai has a SQL based powerful filter. Please read SQLite syntax document to learn details.

Examples of filter

-- match rows which the value of GSM1130181 is larger than 14
GSM1130181 > 14

-- match rows which the value of GSM1130181 is larger than the value of GSM1130182
GSM1130181 > GSM1130182

-- match rows which the value of GSM1130181 or GSM1130182 is larger than 14
max(GSM1130181, GSM1130182) > 14

-- match rows which the value of GSM1130181 is larger than 12 and GSM1130182 is smaller than 11
GSM1130181 > 12 AND GSM1130182 < 11

-- match rows which the value of V starts with 143600
V LIKE "143600%"

5. Plot data

Hyokai has a R based powerful plotter.


6. Summarize columns


7. Convert probe ID to Entrez Gene ID


Join Wizard generate SQL to join tables.
SELECT * FROM probe2gene INNER JOIN expressiondata ON probe2gene.probe_id = expressiondata.V


If you want to tweak tables, please edit SQL. An example, shown in below, is removing unused colums.
SELECT gene_id, expressiondata.* FROM probe2gene INNER JOIN expressiondata ON probe2gene.probe_id = expressiondata.V


If you want to save the table, add "CRATE VIEW newview AS" before the SELECT statement. Please refresh main window to show the new table in main window.
CREATE VIEW newview AS SELECT gene_id, expressiondata.* FROM probe2gene INNER JOIN expressiondata ON probe2gene.probe_id = expressiondata.V


7. Convert probe ID to Entrez Gene Symbol and name

Probe ID and Entrez Gene ID are not human friendly. This example shows how to convert probe ID to Gene Symbol.

7.1 Download gene_info

At first, please download gene_info of Mus musculus to map Entrez Gene ID to Symbol and names. If you want to use latest data, please downlaod a script to generate database and run it.

7.2 Attach database

Attach downloaded database.


7.3 Join tables

Join attached database and newview, and omit unused columns.
SELECT gi.gene_info.Symbol, gi.gene_info.description, newview.* FROM newview INNER JOIN gi.gene_info ON newview.gene_id = gi.gene_info.GeneID


7.4 Find differentially expressed genes

SELECT gi.gene_info.Symbol, gi.gene_info.description, GSM1130181 - GSM1130188 as "diff",newview.* FROM newview INNER JOIN gi.gene_info ON newview.gene_id = gi.gene_info.GeneID ORDER BY diff DESC


FAQ

Cannot plot data

R should be installed to plot. If you already installed R, but plotter is not working, please set Rscript path at the preference.


Developers

Fork on Github

Programming & Web Design & Icon Design Yasunobu OKAMURA
(okamura-NOSPAM-(AT)hyokai.info)
Programming Shu TADAKA
Web Design Kensuke NUMAKURA
Icon Design Tango Desktop Project